
As an investor, you have hundreds of options where you can put your hard-earned money into.
So how to find the right one?
Even though there are ways to estimate how well potential investments perform, you want to know at what risk you make a return.
There is a tool that measures the systematic risk of your portfolio. It is called Beta.
In finance, Beta (a.k.a Treynor Index, or beta coefficient) measures volatility of a specific security by comparing it to a performance of a related benchmark over a period of time.
It comes in handy for assessing the excess return, enabling investors to evaluate how the structure of a portfolio to different levels of systematic risk will affect the return.
Beta can also help you as an investor choose investments that match your preferences.
For instance, if you are a risk-averse type of an investor, you may want to avoid overweighting your portfolio with high-beta stocks to avoid excessive volatility.
So how to measure risk of a stock? Plug in the numbers into the following formula:
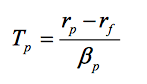
Where,
Rp = portfolio rate of return
Rf = risk-free rate of return
βp= portfolio beta
As a result, you will get a portfolio excess return per unit of risk. Here is a couple of cases that will help you determine whether your portfolio is healthy.
Case 1: Positive Beta
When Rp>Rf and βp>0, we get a larger Treynor ratio. It means a portfolio is well-balanced in terms of risk since its return remains resilient against individual stocks risk.
Case 2: Negative Beta
If Rp<Rf when βp is negative, it means that a portfolio performs poorly.
Even if βp<0 while Rp>Rf, negativity derives from beta, yet it still means the risk of the portfolio performance is justified.
The Treynor index uses the security market line as a benchmark. It measures the slope of a line that starts at a risk-free rate and connects with the point that marks the fund beta and expected return.
Special case:
There is another important case: suppose that Rp<Rf and βp<0, then the ratio becomes positive but in order to classify the funds performance as good or bad, we should check whether Rp lies above or below the security market line.
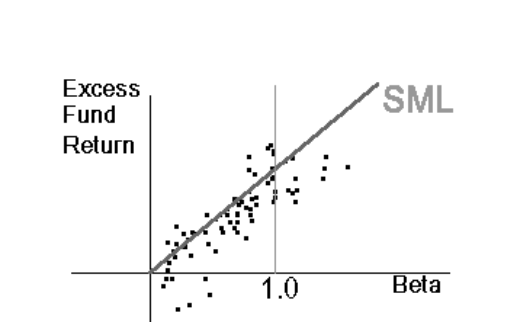
From the graph above we can conclude:
Excess returns of the fund are plotted against the beta. The security market line is drawn with excess returns on the vertical axis. The security market line is the dashed line that starts from zero on the excess return axis. Notice that the mutual funds distributed randomly above and below the security market line.
Alpha and Beta
Both Alpha and Beta are backwards-looking risk indicators.
This means that all calculations are based on the past data, and past performance is no guarantee of he future results. Therefore, they cannot always differentiate between relatively good and poor investments.
Have you used these metrics before? What other tools do you use in your trading? Let me know by leaving your comments below.


