
I’ve seen a lot of bubbles in my time and I have studied even more in history, so I know what I mean by a bubble and I systemized it into a “bubble indicator” that I monitor to help give me perspective on each market.
We now use it to look at most markets we are in. I want to show you how it works and what it is now showing for US stocks.
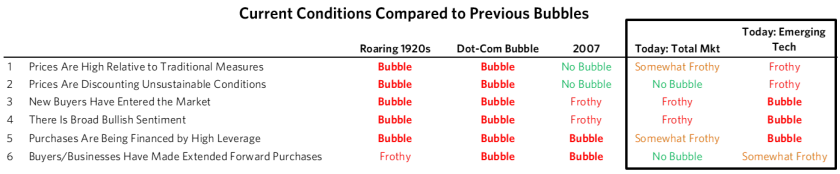
What I mean by a bubble is an unsustainably high price, and how I measure it is with the following six measures:
- How high are prices relative to traditional measures?
- Are prices discounting unsustainable conditions?
- How many new buyers (i.e., those who weren’t previously in the market) have entered the market?
- How broadly bullish is sentiment?
- Are purchases being financed by high leverage?
- Have buyers made exceptionally extended forward purchases (e.g., built inventory, contracted forward purchases, etc.) to speculate or protect themselves against future price gains?
Each of these six influences is measured using a number of stats that are combined into gauges. In the stock market we do it for each stock that we are looking at. These gauges are combined into aggregate indices by security and then for the market as a whole.
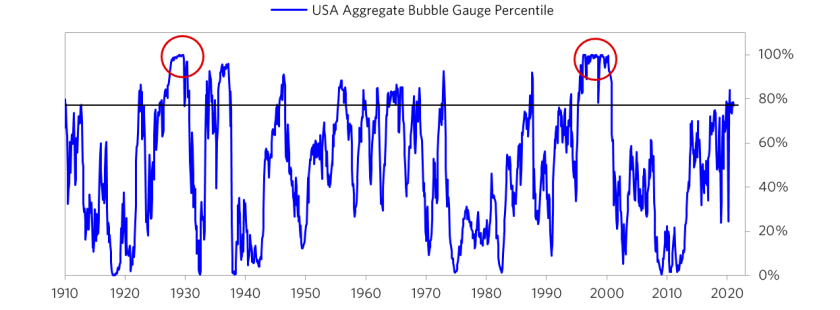
The table below shows the current readings of each of these gauges for the US equity market as a whole, and the chart below it shows the aggregate reading derived by combining these gauges into one reading for the stock market going back to 1910. It shows how the conditions stack up today for US equities in relation to past times.
In brief, the aggregate bubble gauge is around the 77th percentile today for the US stock market overall. In the bubble of 2000 and the bubble of 1929 this aggregate gauge had a 100th percentile read.
There is a very big divergence in the readings across stocks. Some stocks are, by these measures, in extreme bubbles (particularly emerging technology companies), while some stocks are not in bubbles.
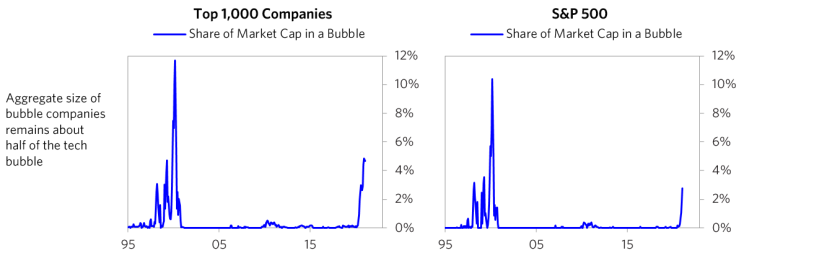
The charts below show the share of US companies that these measures indicate being in a bubble. It is about 5% of the top 1,000 companies in the US, which is about half of what we saw at the peak of the tech bubble. The number is smaller for the S&P 500 as several of the most bubbly companies are not part of that index.
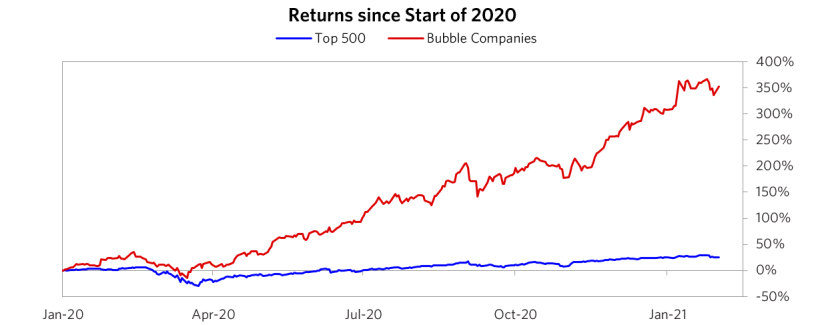
We took the stocks that are in bubbles and created a basket of the “bubble stocks” to keep a close eye on them. The chart below shows their performance and the performance of our basket of the top 500 companies.
This market action is reminiscent of the “Nifty Fifty” in the early 1970s and the dot-com bubble stocks in the late 1990s, both of which I remember well. It scores similarly to the bubble stocks of the late 1920s, which I can’t remember because I wasn’t alive then.
While I won’t show you exactly how this indicator is constructed because that is proprietary, if you’d like to learn more, you can see some of the sub aggregate readings and some indicators here.
This post has originally been published on LinkedIn.
For more investment and finance tips, subscribe to our weekly newsletter and follow us on Twitter, Facebook, Instagram and LinkedIn.


Thank you for this amazing article about the Stock market. This article give us good information.
Hi Amisha,
Thanks for stopping by! 🙂 We are glad to hear you enjoyed our article.
Cheers,
Arthur on behalf of the AlphaGamma team